Below is the raw extracted text layer indexed from the official PDF for search accessibility, screen readers, and quick question search.
राज्य सेवा (मुख्य
परीक्षा
-
२०२५
परीक्षा दिनांक 02 मे, २०२६
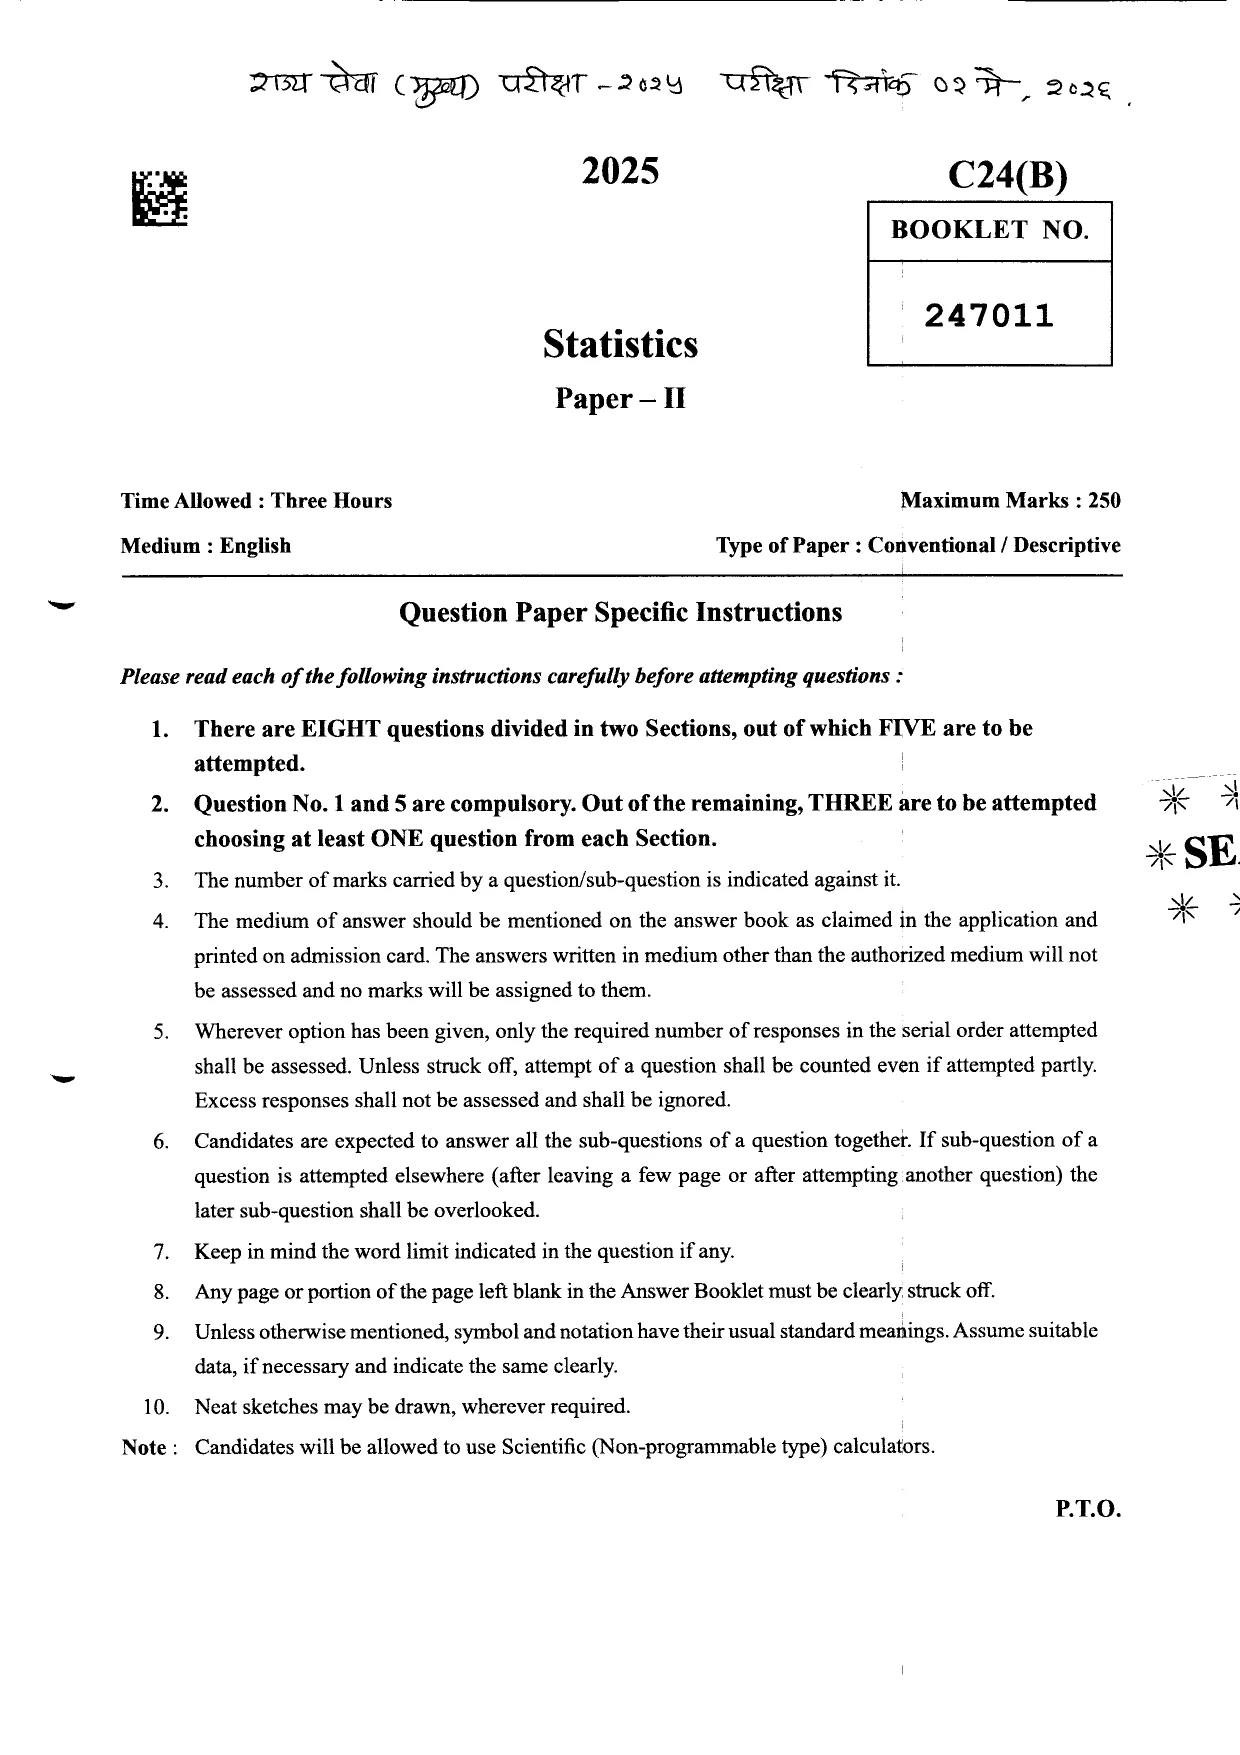
2025
C24(B)
BOOKLET NO.
247011
Statistics
Paper
-
II
Maximum Marks: 250
Time Allowed: Three Hours
Type of Paper : Conventional / Descriptive
Medium: English
Question Paper Specific Instructions
Please read each of the following instructions carefully before attempting questions:
1.
There are EIGHT questions divided in two Sections, out of which FIVE are to be
attempted.
2.
Question No. 1 and 5 are compulsory. Out of the remaining, THREE are to be attempted
choosing at least ONE question from each Section.
*SE
3.
The number of marks carried by a question/sub-question is indicated against it.
4.
The medium of answer should be mentioned on the answer book as claimed in the application and
printed on admission card. The answers written in medium other than the authorized medium will not
be assessed and no marks will be assigned to them.
5.
Wherever option has been given, only the required number of responses in the serial order attempted
shall be assessed. Unless struck off, attempt of a question shall be counted even if attempted partly.
Excess responses shall not be assessed and shall be ignored.
6.
Candidates are expected to answer all the sub-questions of a question together. If sub-question of a
question is attempted elsewhere (after leaving a few page or after attempting another question) the
later sub-question shall be overlooked.
7.
Keep in mind the word limit indicated in the question if any.
8.
Any page or portion ofthe page left blank in the Answer Booklet must be clearly struck off.
9.
Unless otherwise mentioned, symbol and notation have their usual standard meanings. Assume suitable
data, if necessary and indicate the same clearly.
10.
Note:
**
Neat sketches may be drawn, wherever required.
Candidates will be allowed to use Scientific (Non-programmable type) calculators.
P.T.O.
*
�C24(B)
2
SECTION -A
Q1.
Q1.
(10×5=50)
Solve the following:
(a)
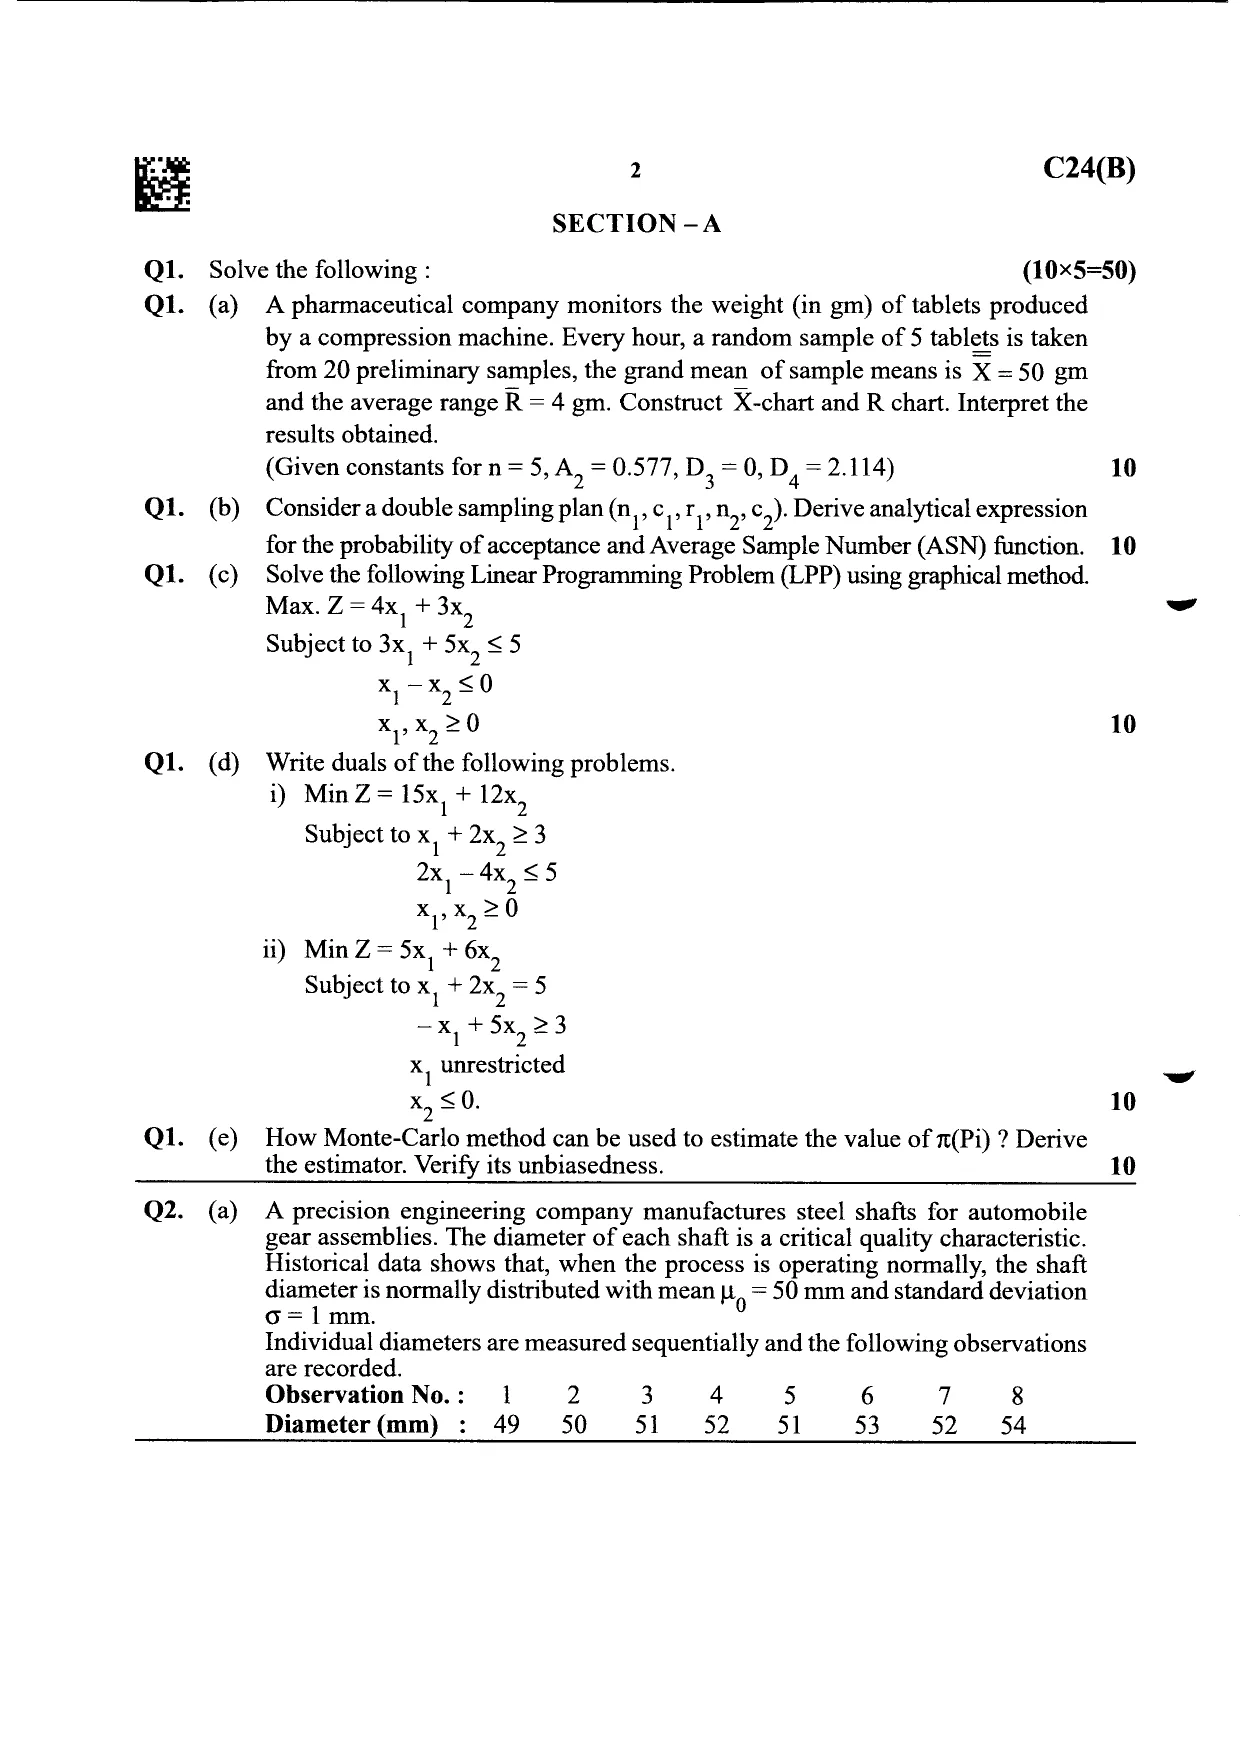
A pharmaceutical company monitors the weight (in gm) of tablets produced
by a compression machine. Every hour, a random sample of 5 tablets is taken
from 20 preliminary samples, the grand mean of sample means is X = 50 gm
and the average range R
results obtained.
=
4 gm. Construct X-chart and R chart. Interpret the
(Given constants for n = 5, A₂ = 0.577, D3 = 0, D = 2.114)
Q1.
(b)
Q1.
(c)
10
Consider a double sampling plan (n1₂ ₂).Derive analytical expression
for the probability of acceptance and Average Sample Number (ASN) function. 10
Solve the following Linear Programming Problem (LPP) using graphical method.
Max. Z = 4x, +3x2
Subject to 3x, +5x, ≤5
x-x≤0
10
x₁, x ≥ 0
Q1.
(d)
Write duals of the following problems.
i)
Min Z= 15x, +
12x,
Subject to x, + 2x, ≥3
2x,-4x2≤5
xx20
ii) Min Z= 5x + 6x,
Subject to x₁ +2x₂= 5
-x, + 5x ≥ 3
x, unrestricted
10
x₂≤0.
Q1. (e)
How Monte-Carlo method can be used to estimate the value of π(Pi)? Derive
the estimator. Verify its unbiasedness.
Q2.
A precision engineering company manufactures steel shafts for automobile
gear assemblies. The diameter of each shaft is a critical quality characteristic.
(a)
Historical data shows that, when the process is operating normally, the shaft
= 50 mm and standard deviation
diameter is normally distributed with mean
0 = 1 mm.
Individual diameters are measured sequentially and the following observations
are recorded.
8
7
6
5
4
3
2
1
Observation No.:
Diameter (mm)
:
49
50
51
52
51
53
52
54
10
�C24(B)
3
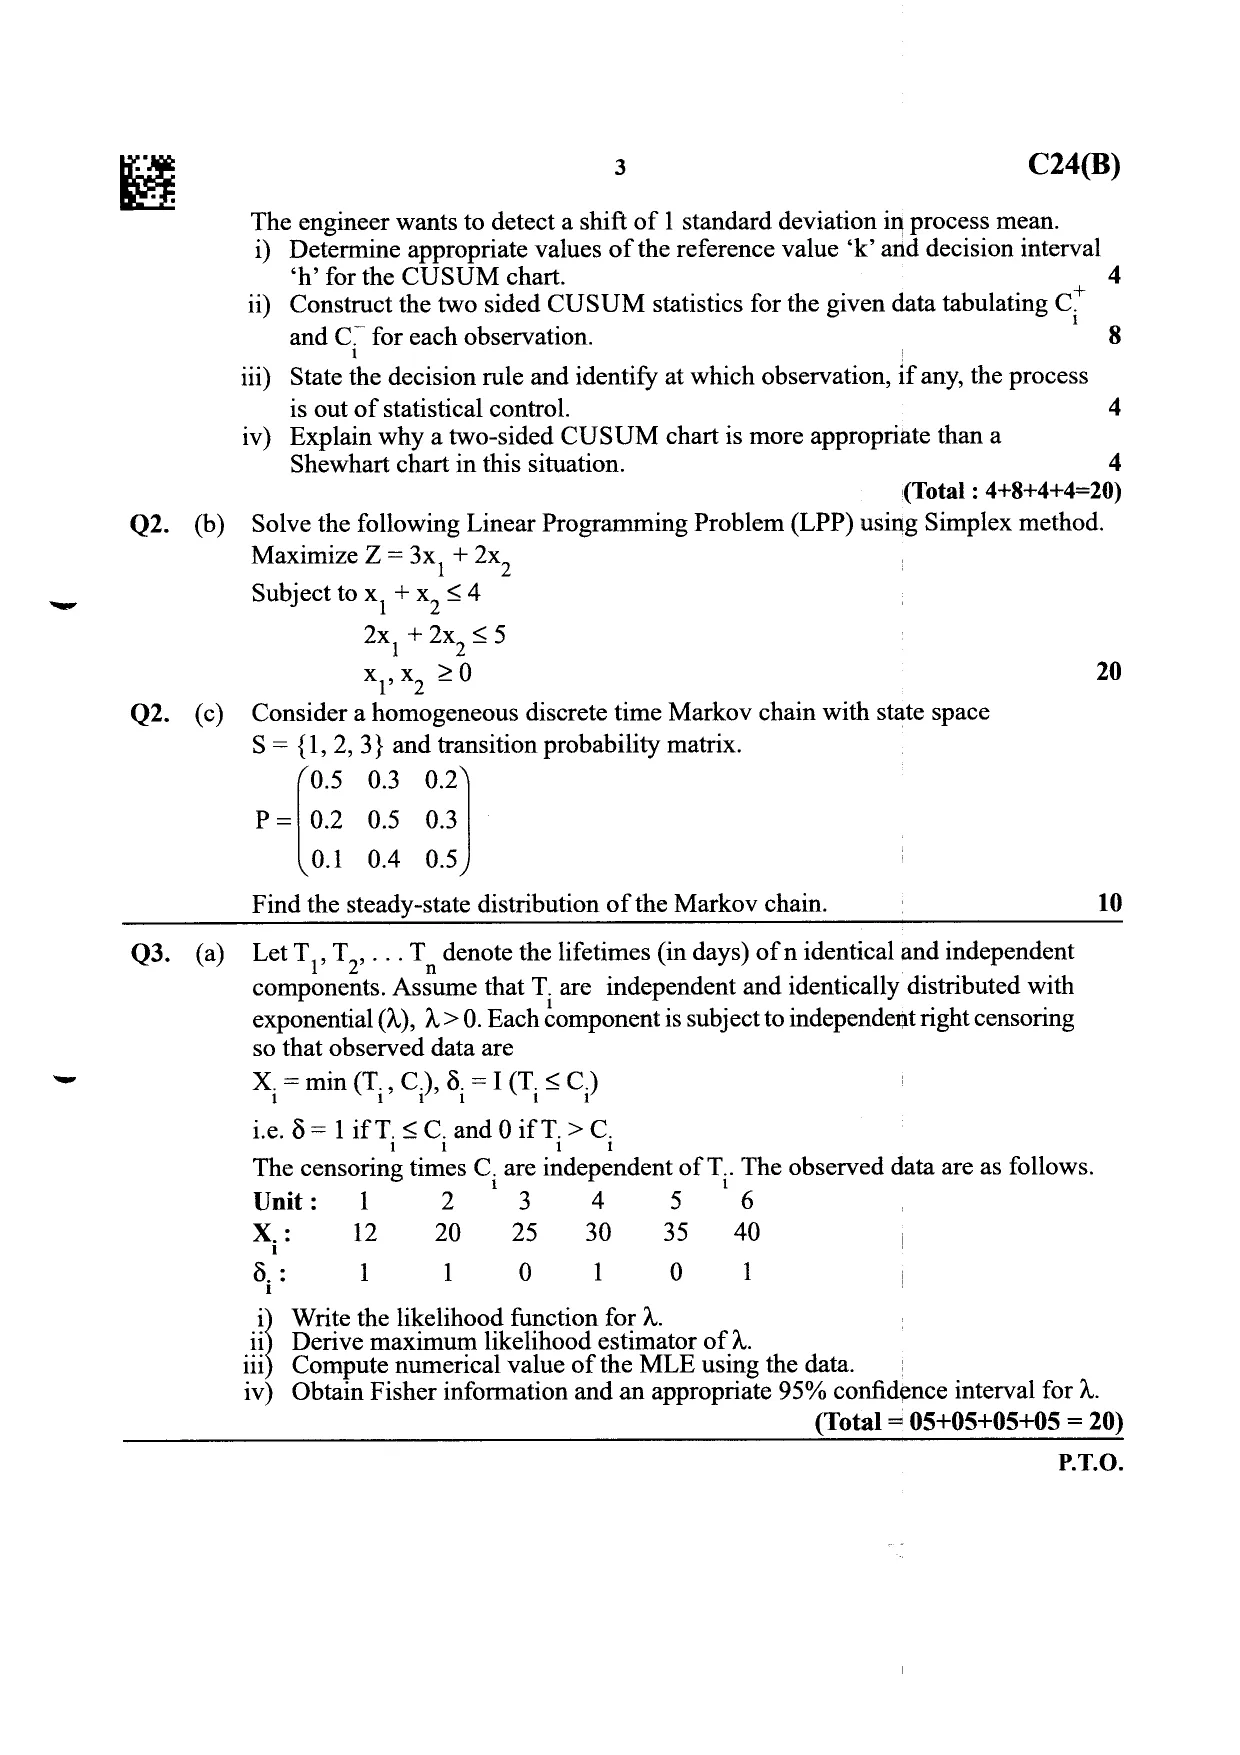
The engineer wants to detect a shift of 1 standard deviation in process mean.
i) Determine appropriate values of the reference value 'k' and decision interval
4
'h' for the CUSUM chart.
ii) Construct the two sided CUSUM statistics for the given data tabulating C
8
and C for each observation.
iii)
State the decision rule and identify at which observation, if any, the process
4
is out of statistical control.
iv) Explain why a two-sided CUSUM chart is more appropriate thana
Shewhart chart in this situation.
Q2.
(b)
4
(Total: 4+8+4+4=20)
Solve the following Linear Programming Problem (LPP) using Simplex method.
Maximize Z = 3x, + 2x2
Subject to x₁ +x₂≤4
2x, +2x2 ≤5
20
xx2 20
Q2.
(c)
Consider a homogeneous discrete time Markov chain with state space
S= {1, 2, 3} and transition probability matrix.
0.5 0.3 0.2
P= 0.2
0.5
0.3
0.1
0.4
0.5
10
Find the steady-state distribution of the Markov chain.
Q3.
(a)
Let T, T,...T denote the lifetimes (in days) of n identical and independent
components. Assume that T. are independent and identically distributed with
exponential (λ), λ>0. Each component is subject to independent right censoring
so that observed data are
X = min (T₁, C), 8 = I (TSC)
i.e. 8 = 1 if T ≤C and 0 if T >C
The censoring times C. are independent of T.. The observed data are as follows.
Unit:
1
2
3
4
5
6
X:
12
20
25
30
35
40
8:
1
0
1
0
1
i) Write the likelihood function for A.
ii) Derive maximum likelihood estimator of λ.
iii) Compute numerical value of the MLE using the data.
iv) Obtain Fisher information and an appropriate 95% confidence interval for A.
(Total = 05+05+05+05 = 20)
P.T.O.
�4
Q3.
(b)
C24(B)
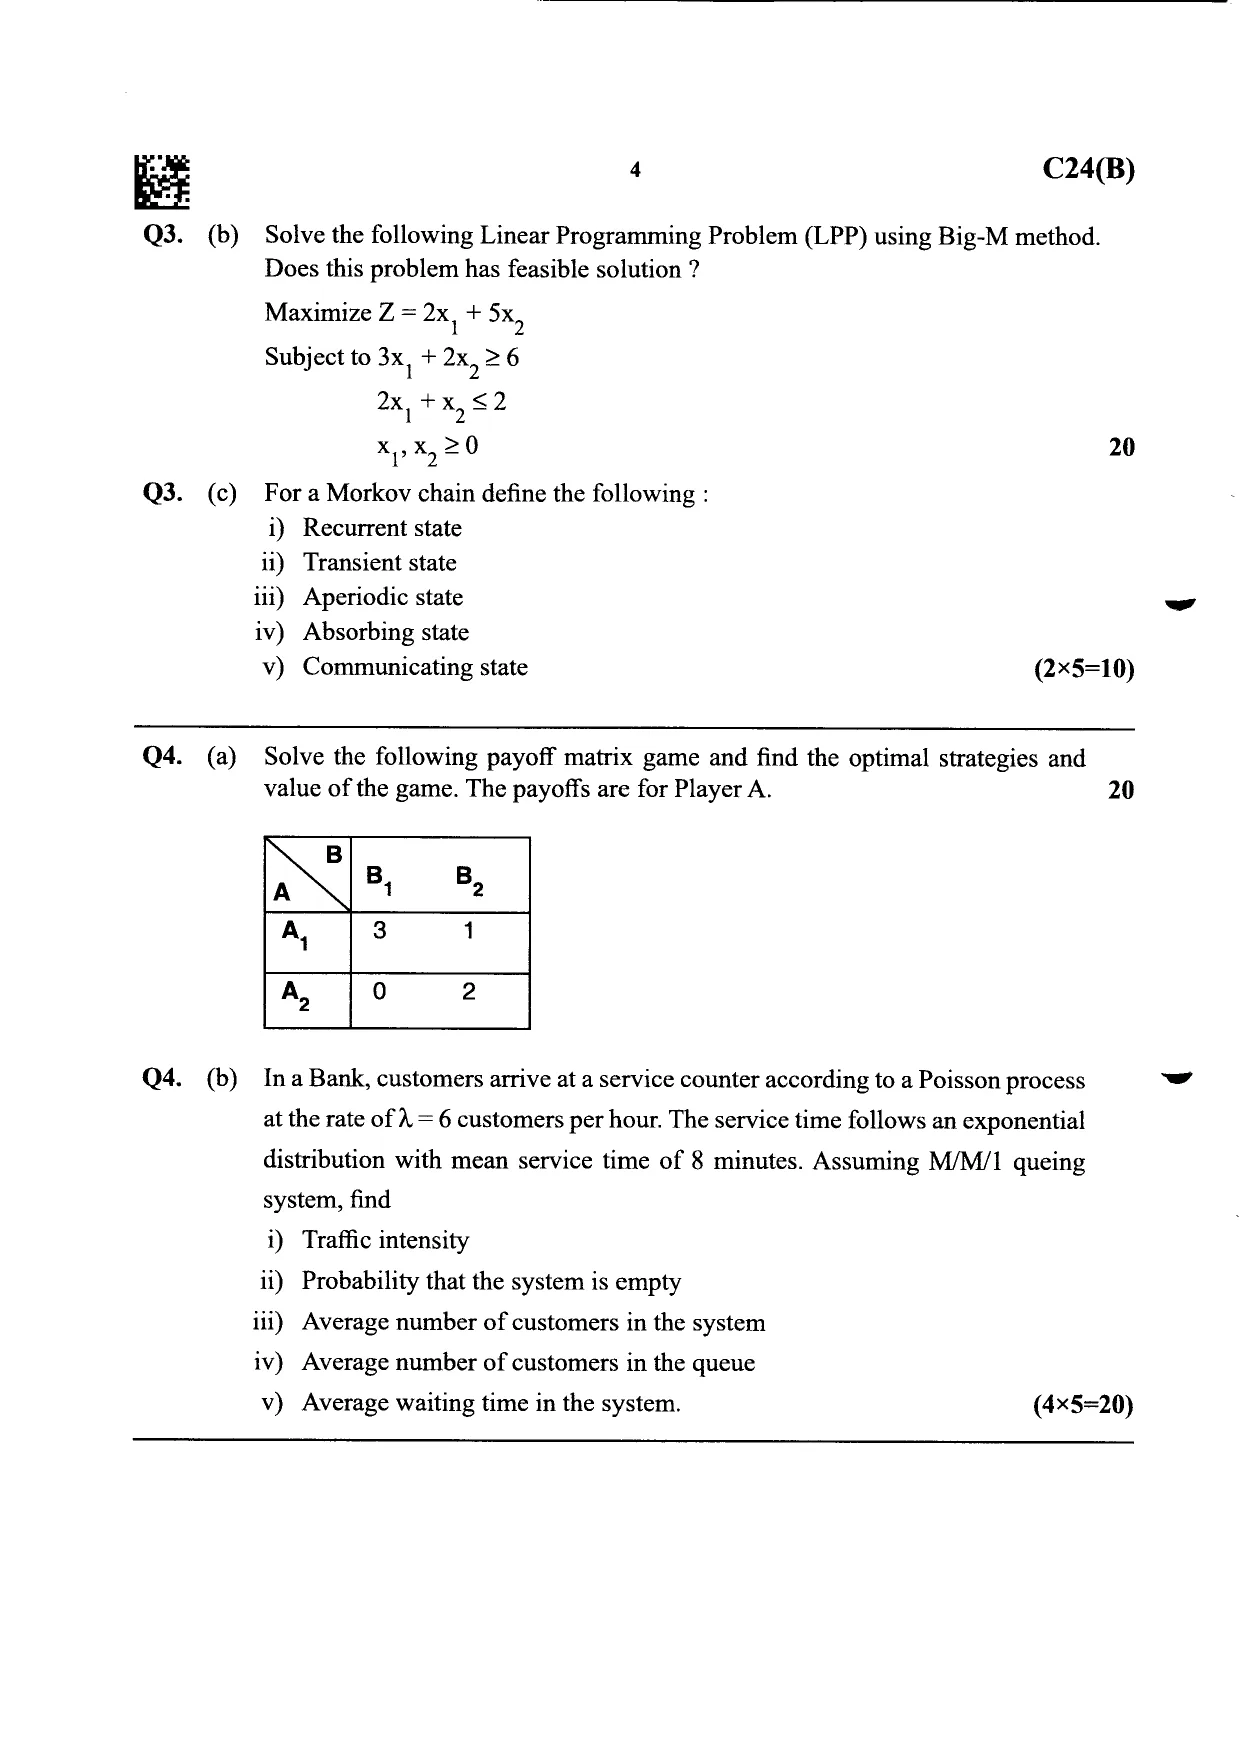
Solve the following Linear Programming Problem (LPP) using Big-M method.
Does this problem has feasible solution?
Maximize Z = 2x, +5x2
Subject to 3x₁ +2x2≥6
2x, +x2≤2
20
xx20
Q3.
(c)
For a Morkov chain define the following :
i) Recurrent state
ii) Transient state
iii) Aperiodic state
iv) Absorbing state
v) Communicating state
Q4.
(a)
Solve the following payoff matrix game and find the optimal strategies and
value of the game. The payoffs are for Player A.
B
Q4.
(b)
(2×5=10)
A
B
B2
A
3
1
A2
이
2
20
In a Bank, customers arrive at a service counter according to a Poisson process
at the rate of λ= 6 customers per hour. The service time follows an exponential
distribution with mean service time of 8 minutes. Assuming M/M/1 queing
system, find
i) Traffic intensity
ii) Probability that the system is empty
iii)
Average number of customers in the system
iv) Average number of customers in the queue
v) Average waiting time in the system.
(4×5=20)
�5
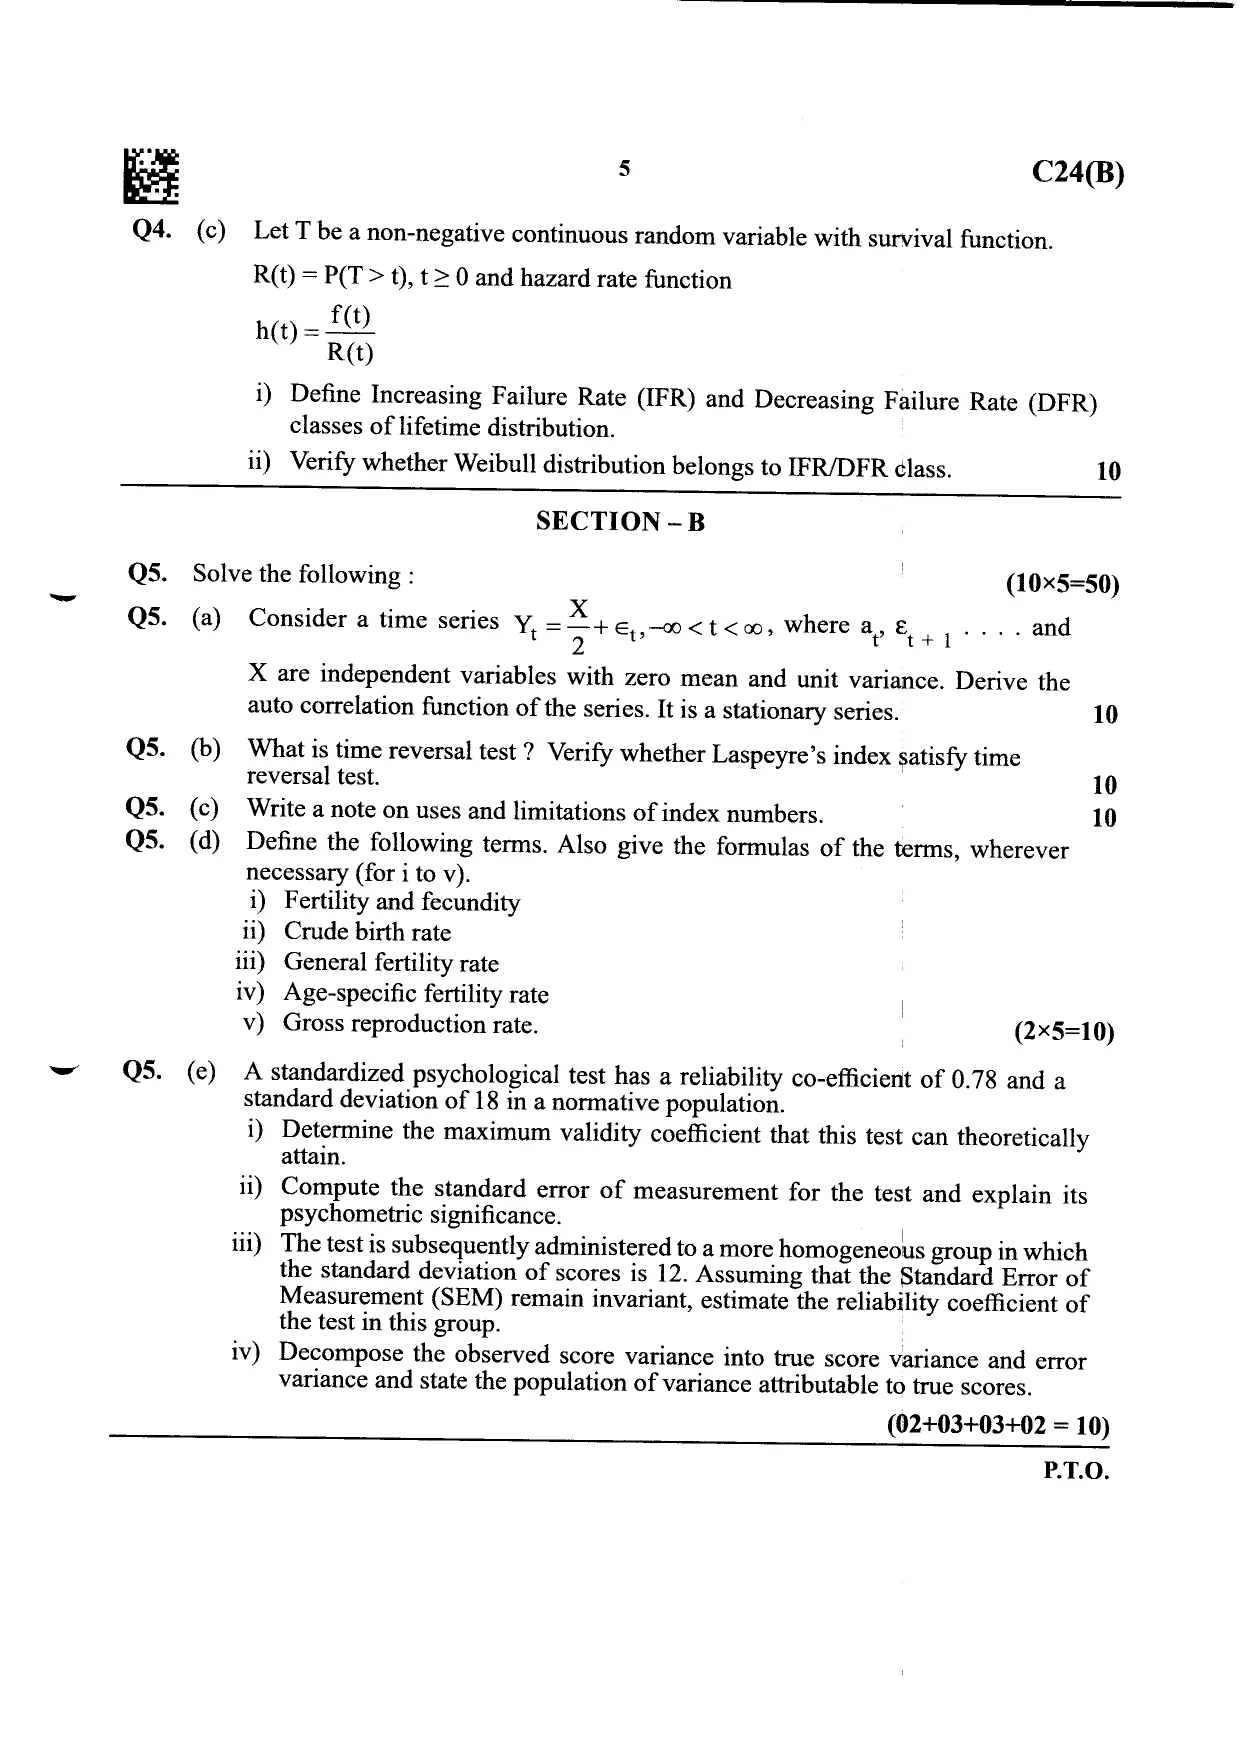
Q4. (c)
C24(B)
Let T be a non-negative continuous random variable with survival function.
R(t) = P(T> t), t ≥ 0 and hazard rate function
h(t)=f(t)
R(t)
i) Define Increasing Failure Rate (IFR) and Decreasing Failure Rate (DFR)
classes of lifetime distribution.
ii) Verify whether Weibull distribution belongs to IFR/DFR class.
SECTION
Q5.
Q5.
-
B
Solve the following :
(a)
(10×5=50)
X
Consider a time series Y =+€₁,-00 <t<0, where a
2
X are independent variables with
10
zero mean
and
+1
&+
and unit variance. Derive the
auto correlation function of the series. It is a stationary series.
10
Q5. (b)
What is time reversal test? Verify whether Laspeyre's index şatisfy time
reversal test.
Q5.
Q5.
(c)
Write a note on uses and limitations of index numbers.
(d)
Define the following terms. Also give the formulas of the terms, wherever
necessary (for i to v).
i) Fertility and fecundity
ii) Crude birth rate
iii) General fertility rate
iv) Age-specific fertility rate
v) Gross reproduction rate.
Q5. (e)
10
10
(2×5=10)
A standardized psychological test has a reliability co-efficient of 0.78 and a
standard deviation of 18 in a normative population.
i) Determine the maximum validity coefficient that this test can theoretically
attain.
ii) Compute the standard error of measurement for the test and explain its
psychometric significance.
iii) The test is subsequently administered to a more homogeneous group in which
the standard deviation of scores is 12. Assuming that the Standard Error of
Measurement (SEM) remain invariant, estimate the reliability coefficient of
the test in this group.
iv) Decompose the observed score variance into true score variance and error
variance and state the population of variance attributable to true scores.
(02+03+03+02
=
10)
P.T.O.
�C24(B)
6
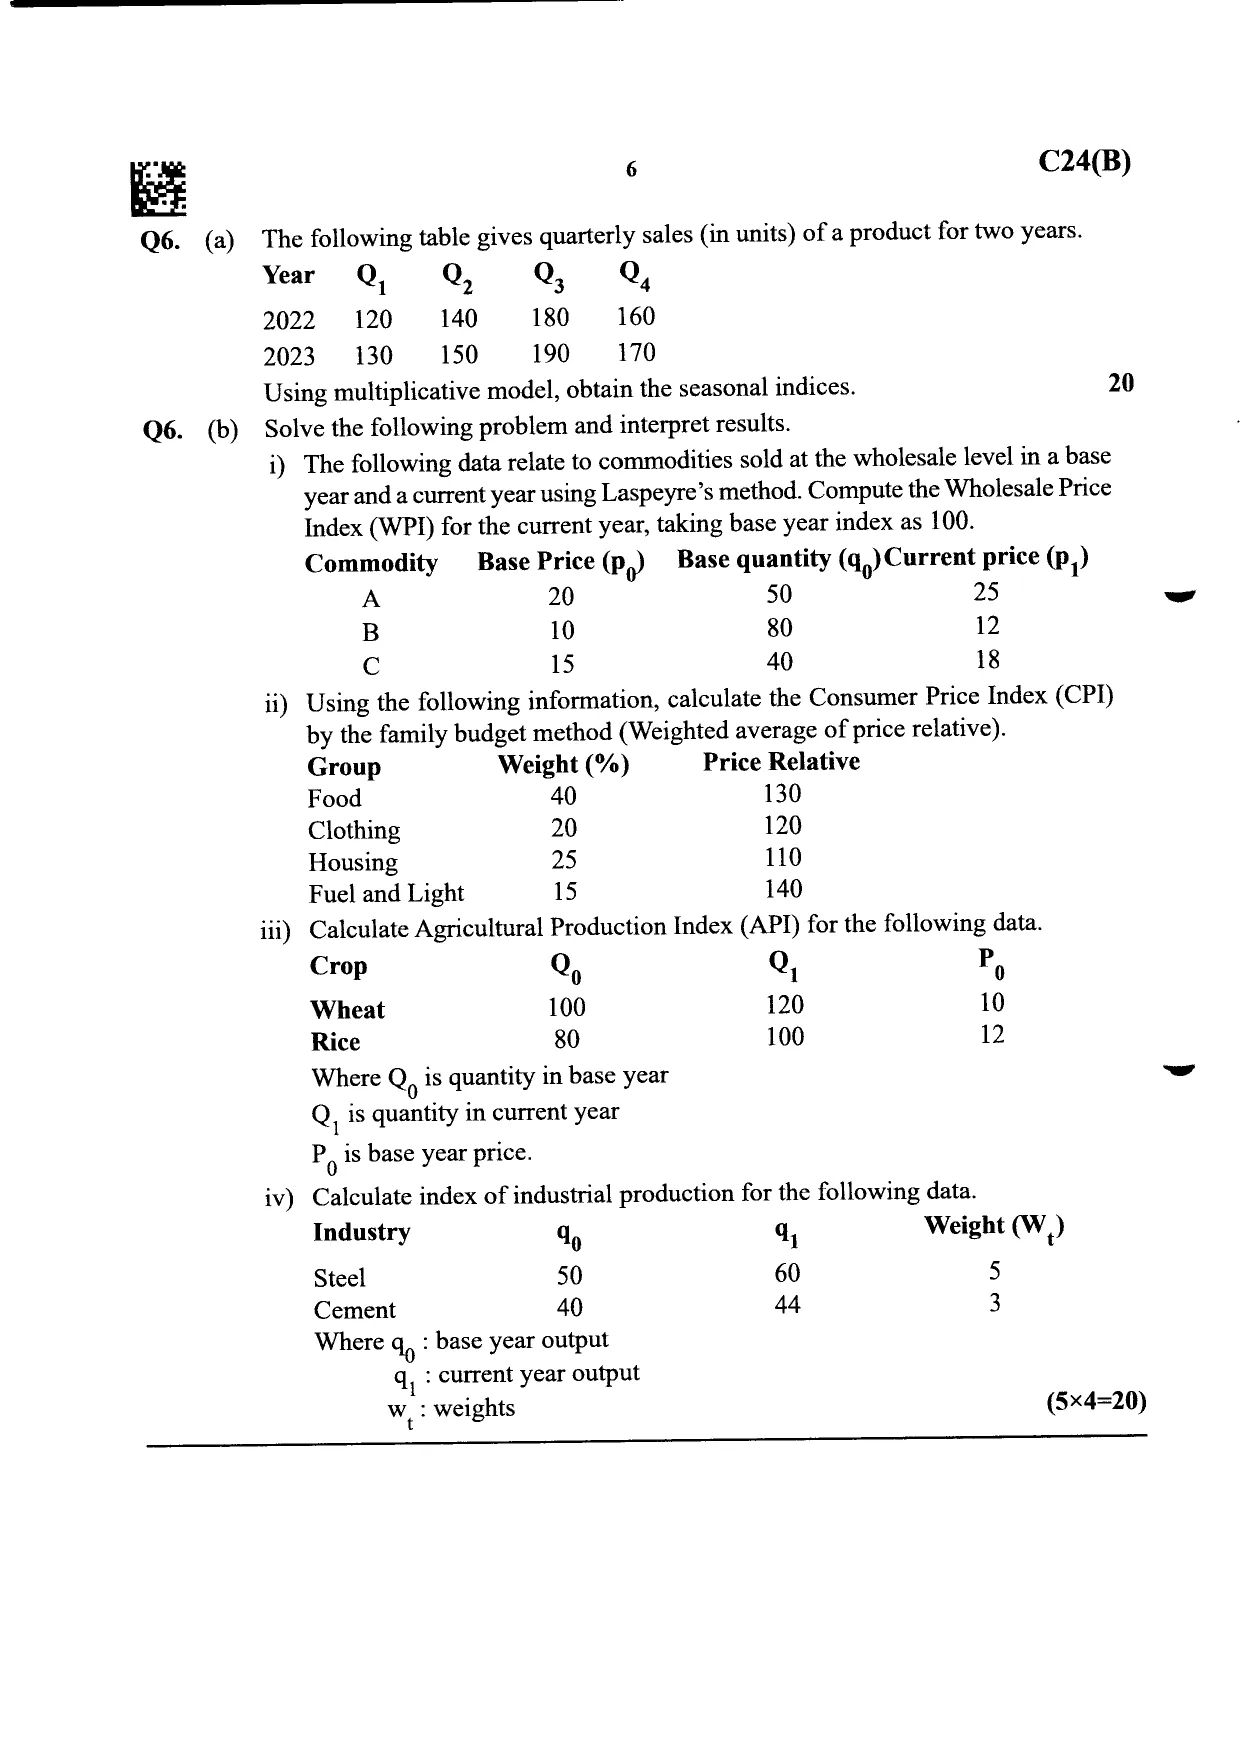
Q6.
(a)
The following table gives quarterly sales (in units) of a product for two years.
Year
Q
Q
Q3
Q4
2022
120
140
180
160
2023
130
150
190
170
20
Using multiplicative model, obtain the seasonal indices.
Q6.
(b)
Solve the following problem and interpret results.
i) The following data relate to commodities sold at the wholesale level in a base
Laspeyre's method. Compute the Wholesale Price
Index (WPI) for the current year, taking base year index as 100.
year and a current year using
Commodity
Base Price (d
Base quantity
50
(q0)Current price (P₁)
25
A
20
B
10
80
12
C
15
40
18
ii) Using the following information, calculate the Consumer Price Index (CPI)
by the family budget method (Weighted average of price relative).
Group
Food
Weight (%)
Price Relative
40
130
20
25
120
110
15
140
Clothing
Housing
Fuel and Light
iii)
Calculate Agricultural Production Index (API) for the following data.
Q
P0
100
120
10
80
100
12
Crop
Wheat
Rice
Where Q is quantity in base year
Q, is quantity in current year
Po is base year price.
iv) Calculate index of industrial production for the following data.
Industry
90
b1
Weight (W)
Steel
50
60
5
Cement
40
44
3
Where qo : base year output
: current year output
w: weights
(5×4=20)
���